
How to Find the Best Cluster Resolution in Seurat Pipeline: In modern single-cell RNA sequencing (scRNA-seq) analysis, identifying the right cluster resolution is crucial for accurate results. Seurat, a widely used R toolkit, provides powerful tools for scRNA-seq analysis, including clustering cells based on gene expression patterns. However, one of the most challenging steps is determining the best cluster resolution. In this guide, we’ll explore how to find the optimal resolution in the Seurat pipeline to improve your clustering accuracy and overall scRNA-seq analysis.
Understanding Clustering in Seurat
Seurat enables researchers to group cells into clusters based on gene expression similarities. These clusters represent different cell types or subtypes, offering insights into cell diversity. Seurat uses a graph-based clustering method that relies on the Louvain algorithm, allowing for the detection of clusters with varying levels of granularity by adjusting a resolution parameter.
What is Cluster Resolution?
Cluster resolution is a parameter that controls how finely you want to divide your data into clusters. A lower resolution value will produce fewer, larger clusters, while a higher resolution value generates more, smaller clusters. The challenge lies in selecting the resolution that strikes a balance between over-splitting (too many small, indistinct clusters) and under-splitting (merging distinct clusters into larger ones).
Why is Finding the Right Resolution Important?
Choosing the right resolution ensures that you accurately capture the biological variability of your data. Too low a resolution may overlook subtle differences between cell types, while too high a resolution might result in splitting biologically similar cells into separate clusters. The right balance maximizes biological interpretability without introducing noise or overcomplicating the analysis.
Steps to Find the Best Cluster Resolution in Seurat
Now that we understand the importance of cluster resolution, let’s explore the steps involved in finding the best cluster resolution in the Seurat pipeline.
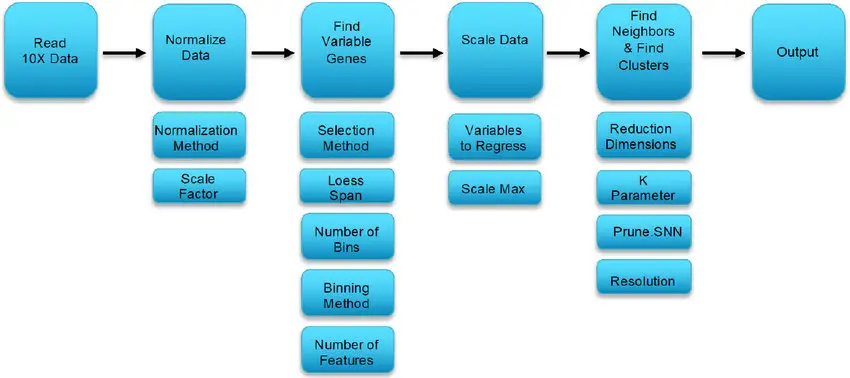
Pre-process Your Data
Before diving into clustering, it’s essential to pre-process your data to remove noise and normalize expression levels.
- Filtering: Remove cells with extremely low or high gene counts, which might represent empty droplets or doublets.
- Normalization: Use Seurat’s
NormalizeData()function to normalize the gene expression values, making the data more comparable across cells. - Variable Feature Selection: Identify the most variable genes using the
FindVariableFeatures()function to focus the analysis on genes that show the most variation across cells.
rCopy codeseurat_object <- NormalizeData(seurat_object)
seurat_object <- FindVariableFeatures(seurat_object)
Dimensionality Reduction
After pre-processing, reduce the dimensionality of your data to focus on the main sources of variation.
- PCA (Principal Component Analysis): Seurat uses PCA to reduce dimensionality. The
RunPCA()function identifies key principal components that capture most of the variation in your data.
rCopy codeseurat_object <- RunPCA(seurat_object)
You can determine the number of principal components to use by examining the elbow plot (ElbowPlot()). Select a reasonable number of PCs to retain enough biological variation while avoiding noise.
Construct a Nearest-Neighbor Graph
Once you’ve performed PCA, the next step is to construct a nearest-neighbor graph. This graph captures the relationships between cells based on their proximity in the reduced dimensional space.
rCopy codeseurat_object <- FindNeighbors(seurat_object, dims = 1:10)
The FindNeighbors() function uses the reduced data to build the graph structure, which will be essential for clustering.
Run Clustering Algorithm
Now you can perform clustering using the FindClusters() function. This step uses the Louvain algorithm to group cells into clusters. The key here is the resolution parameter, which controls the number of clusters.
rCopy codeseurat_object <- FindClusters(seurat_object, resolution = 0.5)
You can test different resolution values by adjusting the parameter. For example, you might try resolutions such as 0.2, 0.5, 1, and 2. A higher value leads to more clusters, while a lower value results in fewer clusters.
Evaluate Different Resolutions
Once you’ve clustered your data at different resolutions, evaluate the resulting clusters to determine which resolution works best for your dataset.
- Visualize with UMAP or t-SNE: Use UMAP (
RunUMAP()) or t-SNE (RunTSNE()) to visualize your clusters in two dimensions. Check whether clusters are well-separated and whether known cell types are grouped correctly.
rCopy codeseurat_object <- RunUMAP(seurat_object, dims = 1:10)
DimPlot(seurat_object, reduction = "umap")
- Marker Gene Analysis: Use known marker genes for different cell types to assess the biological relevance of your clusters. Run
FindMarkers()to identify genes that distinguish one cluster from another, then compare these marker genes to known cell type markers.
rCopy codemarkers <- FindMarkers(seurat_object, ident.1 = 1, ident.2 = 2)
- Cluster Stability: Check how stable the clusters are by running the clustering algorithm multiple times with different random seeds. If the clusters remain consistent, your chosen resolution is likely robust.
Consider Biological Relevance
It’s essential to align your clustering results with known biology. For example, if your study focuses on a specific cell type or tissue, the resolution should reflect that biological knowledge. Consulting with domain experts or using external data (such as publicly available scRNA-seq datasets) can provide valuable insights into whether your clusters are biologically meaningful.
People also search What is the Best Staff in BO3 Zombies?
Use Silhouette Scores or Similar Metrics
You can also use quantitative metrics like silhouette scores to assess how well-separated your clusters are. A silhouette score close to 1 indicates well-separated clusters, while a score near 0 suggests that cells are not clearly grouped.
Iterate and Refine
Finding the best cluster resolution is an iterative process. Start with a range of resolutions and narrow down based on visualization, marker gene analysis, and biological relevance. Repeat this process until you’re confident that you’ve identified the best resolution for your data.
Conclusion
Determining the best cluster resolution in the Seurat pipeline requires balancing granularity and biological relevance. By pre-processing your data, using dimensionality reduction, constructing a nearest-neighbor graph, and evaluating clusters across different resolutions, you can find the optimal parameter for your analysis. Always validate your clusters using visualization, marker genes, and known biological information to ensure the most accurate results.
In your scRNA-seq studies, finding the right cluster resolution is essential for capturing the complexity of cellular heterogeneity. Taking the time to explore different resolutions and assess the biological relevance of your clusters will lead to more meaningful insights from your data.