What Survivorship Curve Best Represents Humans? When studying population dynamics and understanding how different species live and die, biologists often turn to survivorship curves. These curves provide a visual representation of the likelihood of survival within a population across different stages of life. In this article, we will dive into what survivorship curves are, identify which one best represents humans, and explain why this is the case, with a focus on various biological and societal factors that influence human survivorship.
What is a Survivorship Curve?
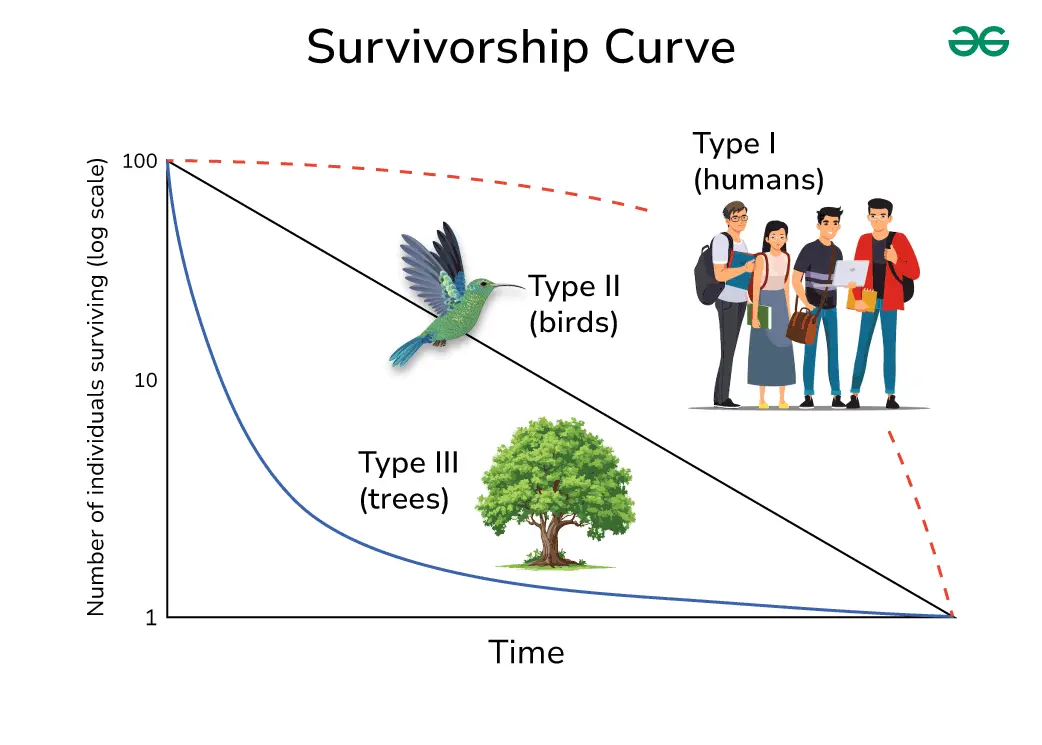
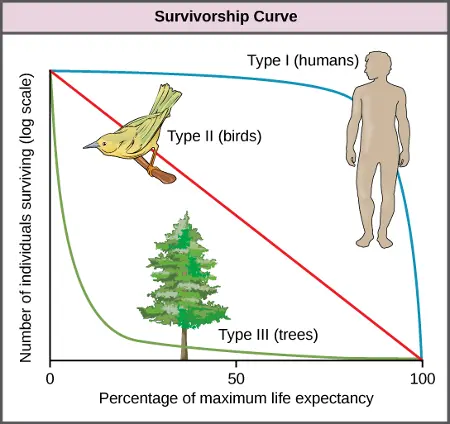
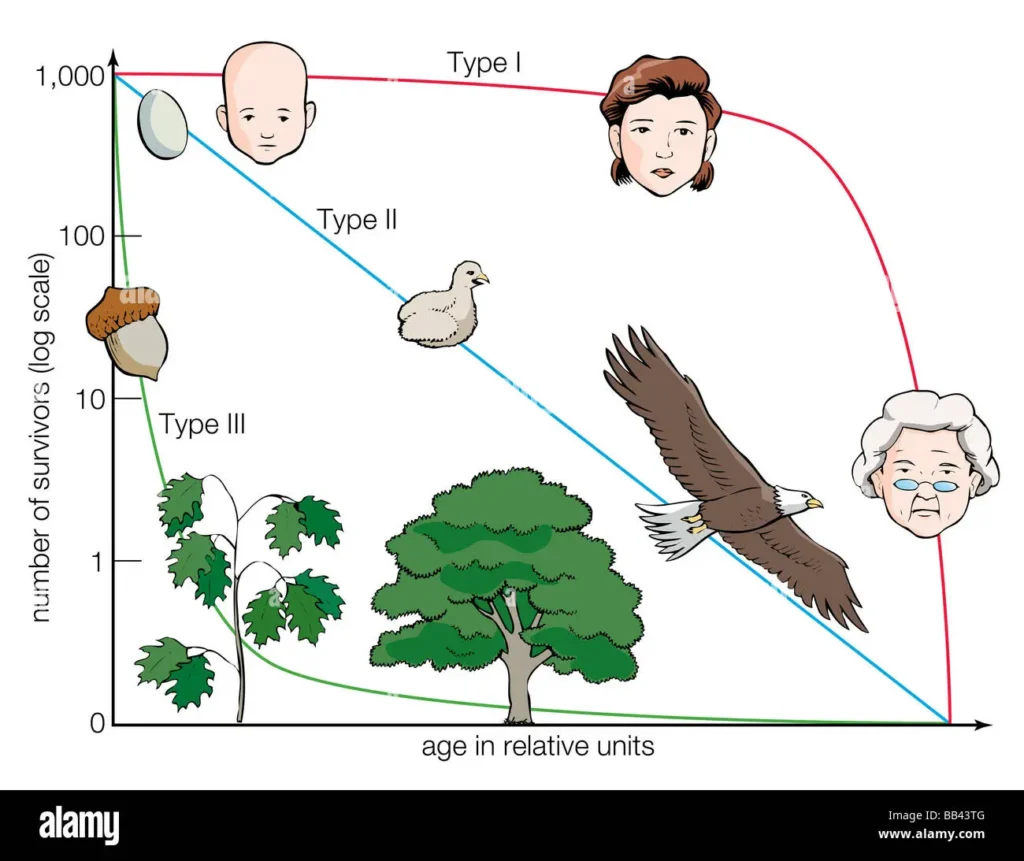
A survivorship curve is a graph that shows the number or proportion of individuals surviving at each age for a given species or group. These curves are often categorized into three distinct types:
- Type I Curve: High survival rates during early and middle life, followed by a steep drop in survival in older age groups.
- Type II Curve: A constant mortality rate throughout the lifespan, meaning individuals have an equal chance of dying at any age.
- Type III Curve: High mortality rates in early life, but those who survive the early stages tend to live longer.
Each type of curve reveals insights into the reproductive strategies, life history, and environmental challenges faced by a species. Now, let’s explore which of these curves applies to humans.
The Survivorship Curve for Humans: Type I
Humans, particularly in developed countries, are best represented by a Type I survivorship curve. This curve indicates that the majority of individuals live to old age, and mortality is concentrated in the later stages of life. A Type I curve starts flat, showing that early life mortality is low. It remains relatively constant through middle age, before declining sharply as the population reaches older age brackets.
Several factors contribute to this trend in humans:
- Low infant mortality rates: In developed nations, medical advancements, proper healthcare, and improved living conditions have significantly reduced infant mortality rates. Vaccinations, prenatal care, and education have all played crucial roles in ensuring that most individuals survive childhood.
- Longevity: With advancements in medicine, technology, and sanitation, people are living longer than ever. Access to healthcare, preventive medicine, and treatments for chronic diseases allow individuals to live to advanced ages.
- Social structures: Family support systems, community resources, and government programs such as Social Security and Medicare help support the elderly, further increasing survival rates among older adults.
Historical Shifts in Human Survivorship
In ancient times or in less-developed regions, humans exhibited survivorship trends closer to a Type II or even Type III curve, depending on environmental conditions. Before modern medical advances, high rates of infant mortality, disease outbreaks, and poor living conditions meant that many individuals died at young ages, often skewing the curve towards Type II.
However, as societies have progressed and living conditions have improved, the curve has shifted dramatically toward Type I. These improvements include:
- Sanitation and hygiene: Clean water, proper waste disposal, and personal hygiene practices significantly reduced the spread of infectious diseases, which used to be major causes of early death.
- Medical advances: Vaccines, antibiotics, and other medical breakthroughs helped combat life-threatening diseases. Surgical techniques and the management of chronic conditions such as diabetes or heart disease extended the lifespan of millions.
- Nutrition: Improved access to nutritious food has contributed to better overall health, particularly in childhood, reducing mortality rates among the young.
Today, even in developing countries, the global human survivorship curve increasingly resembles Type I as healthcare access improves.
Comparison with Other Species
To better understand why humans follow a Type I curve, it’s useful to compare them with species that follow the other two types of survivorship curves.
Type II Survivorship Curve Examples
A Type II survivorship curve, where mortality is constant throughout life, is often seen in species such as birds or small mammals like squirrels. In these species, death can occur at any stage of life due to a range of factors like predation or environmental hazards. These animals don’t have a distinct period of low or high survival, and their mortality risk is spread evenly across their lifespan.
For humans, modern life has largely insulated us from the random and frequent dangers that Type II species face. Healthcare, safety regulations, and social support systems significantly reduce the risk of death at younger ages.
Type III Survivorship Curve Examples
A Type III survivorship curve is seen in species that produce large numbers of offspring, most of which die young. Examples include plants, fish, and many invertebrates. These species often invest little time in parental care, leading to high mortality rates in the early stages of life. However, those that survive the vulnerable period tend to live much longer.
Humans contrast sharply with this pattern. While our ancestors might have faced higher mortality in earlier life stages, modern humans invest considerable time and resources in raising children, which increases survival rates dramatically.
People also search What Other Healer Pairs Best With Smokey In Arena?
Factors Influencing Human Survivorship
Human survivorship isn’t uniform across the globe. Various factors influence the exact shape of the Type I curve for different populations:
Healthcare Access
Countries with advanced healthcare systems, like the U.S., Japan, and many European nations, see significantly higher life expectancies. Access to medical care, preventive screenings, and life-saving surgeries all contribute to this trend.
Economic Conditions
Poverty is a significant determinant of life expectancy. In low-income regions, people often lack access to proper healthcare, nutrition, and sanitation, leading to higher infant mortality rates and shorter life expectancies.
Education
Education, especially for women, has been shown to directly impact survivorship. More educated populations tend to have fewer children but invest more in their health and education, resulting in better overall health outcomes for families.
Lifestyle Choices
Choices related to diet, exercise, and habits such as smoking or alcohol consumption play a role in shaping the human survivorship curve. Populations with higher incidences of obesity, smoking, or substance abuse may experience a slight deviation from the ideal Type I curve, especially in the form of increased deaths in middle age due to preventable diseases like heart disease and cancer.
The Future of Human Survivorship
As technology and medical science continue to advance, the Type I curve for humans may flatten even further, pushing death to even older ages. Future breakthroughs in genetics, nanotechnology, and regenerative medicine might further extend life expectancy. On the other hand, challenges like climate change, pandemics, and emerging diseases could introduce new factors that affect human survivorship.
Conclusion
Humans are best represented by a Type I survivorship curve, characterized by high survival rates throughout most of life and concentrated mortality in old age. This is largely due to medical advances, improved living conditions, and social systems that support the elderly. While survivorship curves for humans were likely closer to Type II in ancient times, the modern world has pushed humanity into a distinctly Type I pattern. Looking ahead, continued advancements in science and healthcare may extend the human lifespan even further, reinforcing this trend.